From no website to 206 leads in a month.
An interior design and fit-out firm in Chennai, India relied on referrals. We built the website, search, ads and Instagram from scratch, and the firm closed contracts straight from those leads. This is a Chennai client, not a US one.



9,225May
11,342Jun
32,744Jul
4,420Aug
163,842
Interiors sell on pictures. 163,842 views in one month.
We ran Instagram, Facebook and YouTube as three separate problems and reported each one on its own. Instagram, with organic posts only, carried the most reach.
- 163,842 Instagram views in AugustOrganic only, no paid boost. Up from 4,420 in July.
- 1,058 new followers in AugustThe account had 4 new followers in July.
- July fell 87%, and we say soViews dropped from 32,744 to 4,420. The cause is still under review.
Contracts closed straight from our leads.
The firm closed interior design and fit-out contracts directly from the lead system we built. The client verified this. We do not show contract values on this page.
Build this for my business →
Stock photo, for illustration.
Four gaps in March.
Great work, no way for a stranger to find it.
- No digital foundationNo website, no SEO, no tracking and no content plan. Month one was a ground-up build.
- A visual business nobody could seeInteriors sell on portfolio. There was nowhere to show the work to people searching for it.
- No lead engineEnquiries came only from referrals. Nothing was generated, so nothing could be forecast.
- Three platforms, no strategyInstagram, Facebook and YouTube each need different content. None had a plan.
Five channels, built from scratch.
 Website
Built in-house and live in two months, with 55 real project photos and testimonials. Analytics and tracking connected.
 SEO
SEO
Keyword research in month one, then service pages and Core Web Vitals fixes. Lighthouse speed score 92.
 Meta Ads
Lead campaigns on Facebook and Instagram. We tested static against video and consolidated behind the performers.
Social media
Instagram, Facebook and YouTube run as three separate problems and reported separately. YouTube passed 30 subscribers and 35.7 watch hours.
 Google Business Profile
Local listing maintained and tracked on calls and direction requests. The 5.0 star rating held five months.
Six months, month by month.
Build, launch, scale, hold, then a recovery and a regression.
Build
Website 80% done. Keyword research and content calendar finished. Two social platforms live.
MarchLaunch
Website 100% live with analytics. First Meta campaign ran 14 days and brought 53 leads. YouTube launched with 15 videos.
AprilFirst full month
212 leads and cost per lead down 36%. Four SEO pages live at average position 9.0. Lighthouse 92.
MayHeld steady
About 210 leads a month at a steady cost. July had the lowest cost per lead. One keyword reached the top 3.
June to JulyRecover and regress
Instagram views hit 163,842. A second keyword reached the top 3. Leads fell to 180 and cost per lead rose 43%.
AugustWhat six months produced.
What went wrong, and what we did.
Three setbacks in six months. We report all of them, because the trend is what counts.
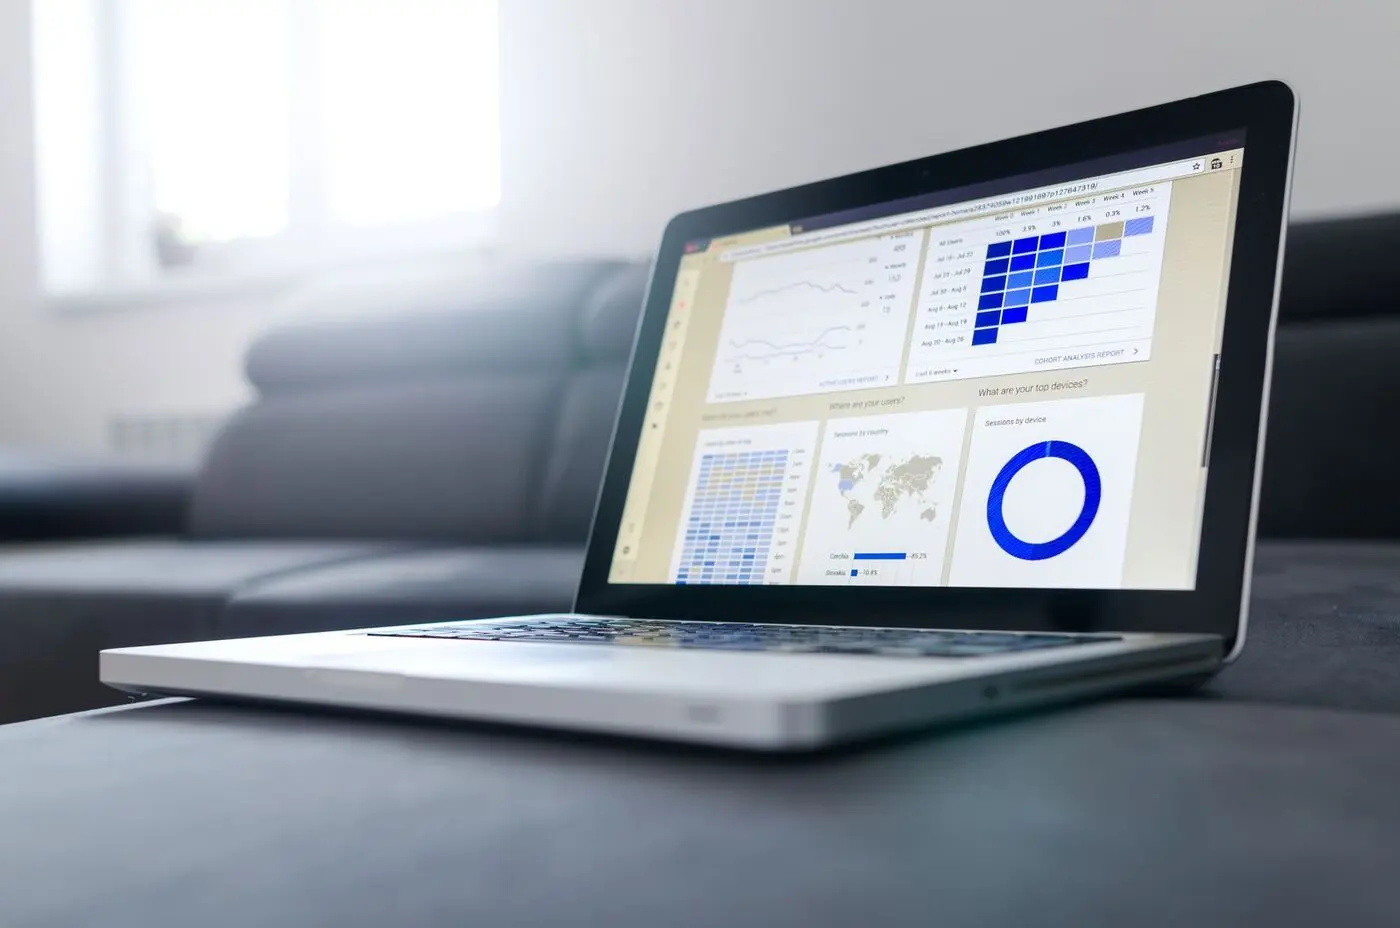
Stock photo, for illustration.
The first campaign ran hot
A cold account has no creative history. First campaigns cost more. May ran a full month with the learning applied: cost per lead down 36%, then steady.
Instagram views fell 87%
Views dropped from 32,744 to 4,420. Posting volume does not explain it. It recovered in August. Cause still under review.
Cost per lead rose 43%
Leads fell to 180. Cost per lead is still below the first campaign, but the direction is wrong. We are diagnosing creative fatigue against seasonal shifts.
Stock photo, for illustration.
Start from zero. Judge the trend.
- No website is not a dead endA firm with no website can still get a steady flow of enquiries in a few months.
- The first campaign is for learningJudge the trend, not month one.
- Show the work everywhereA portfolio business needs its work on the site, on video and on a rated Google profile.
Want results like these?
Start with a free Report Zero audit, valued at $750. We look at your site, search visibility and ads, and you keep the findings either way.
- We call you within 30 minutes
- A written plan within 48 hours
- No obligation, no sales pressure
Get your free audit
Operating from India · serving US businesses.
Get my free audit → Back to digital marketing portfolio